After 1H, 13C is easily the next most important nuclide in the NMR periodic table; 13C measurements can provide a wealth of valuable structural info. Unfortunately, with a receptivity that is around 5,500 smaller than that of 1H, 13C is a much less sensitive nuclide. This lower sensitivity demands the maximum performance from the NMR spectrometer to keep the measurement times and sample concentration within practical limits. Since 13C NMR has the reputation to be challenging even for high field spectrometers, people tend to think that only overnight experiments can be performed on bench top systems. In the first example below we want to show you that even at frequencies like 43, 60 or 80 MHz high quality 13C spectra can be acquired in a single scan. If your goal is to teach the principles of 13C NMR to students, it is worth knowing that good 13C NMR spectra can be acquired on concentrated organic liquid samples in just under a minute. Moreover students can collect a whole set of powerful multidimensional heteronuclear experiments in well under an hour. The spectrum below of neat propylbenzoate could serve as a useful example for teaching 13C NMR in an educational environment.
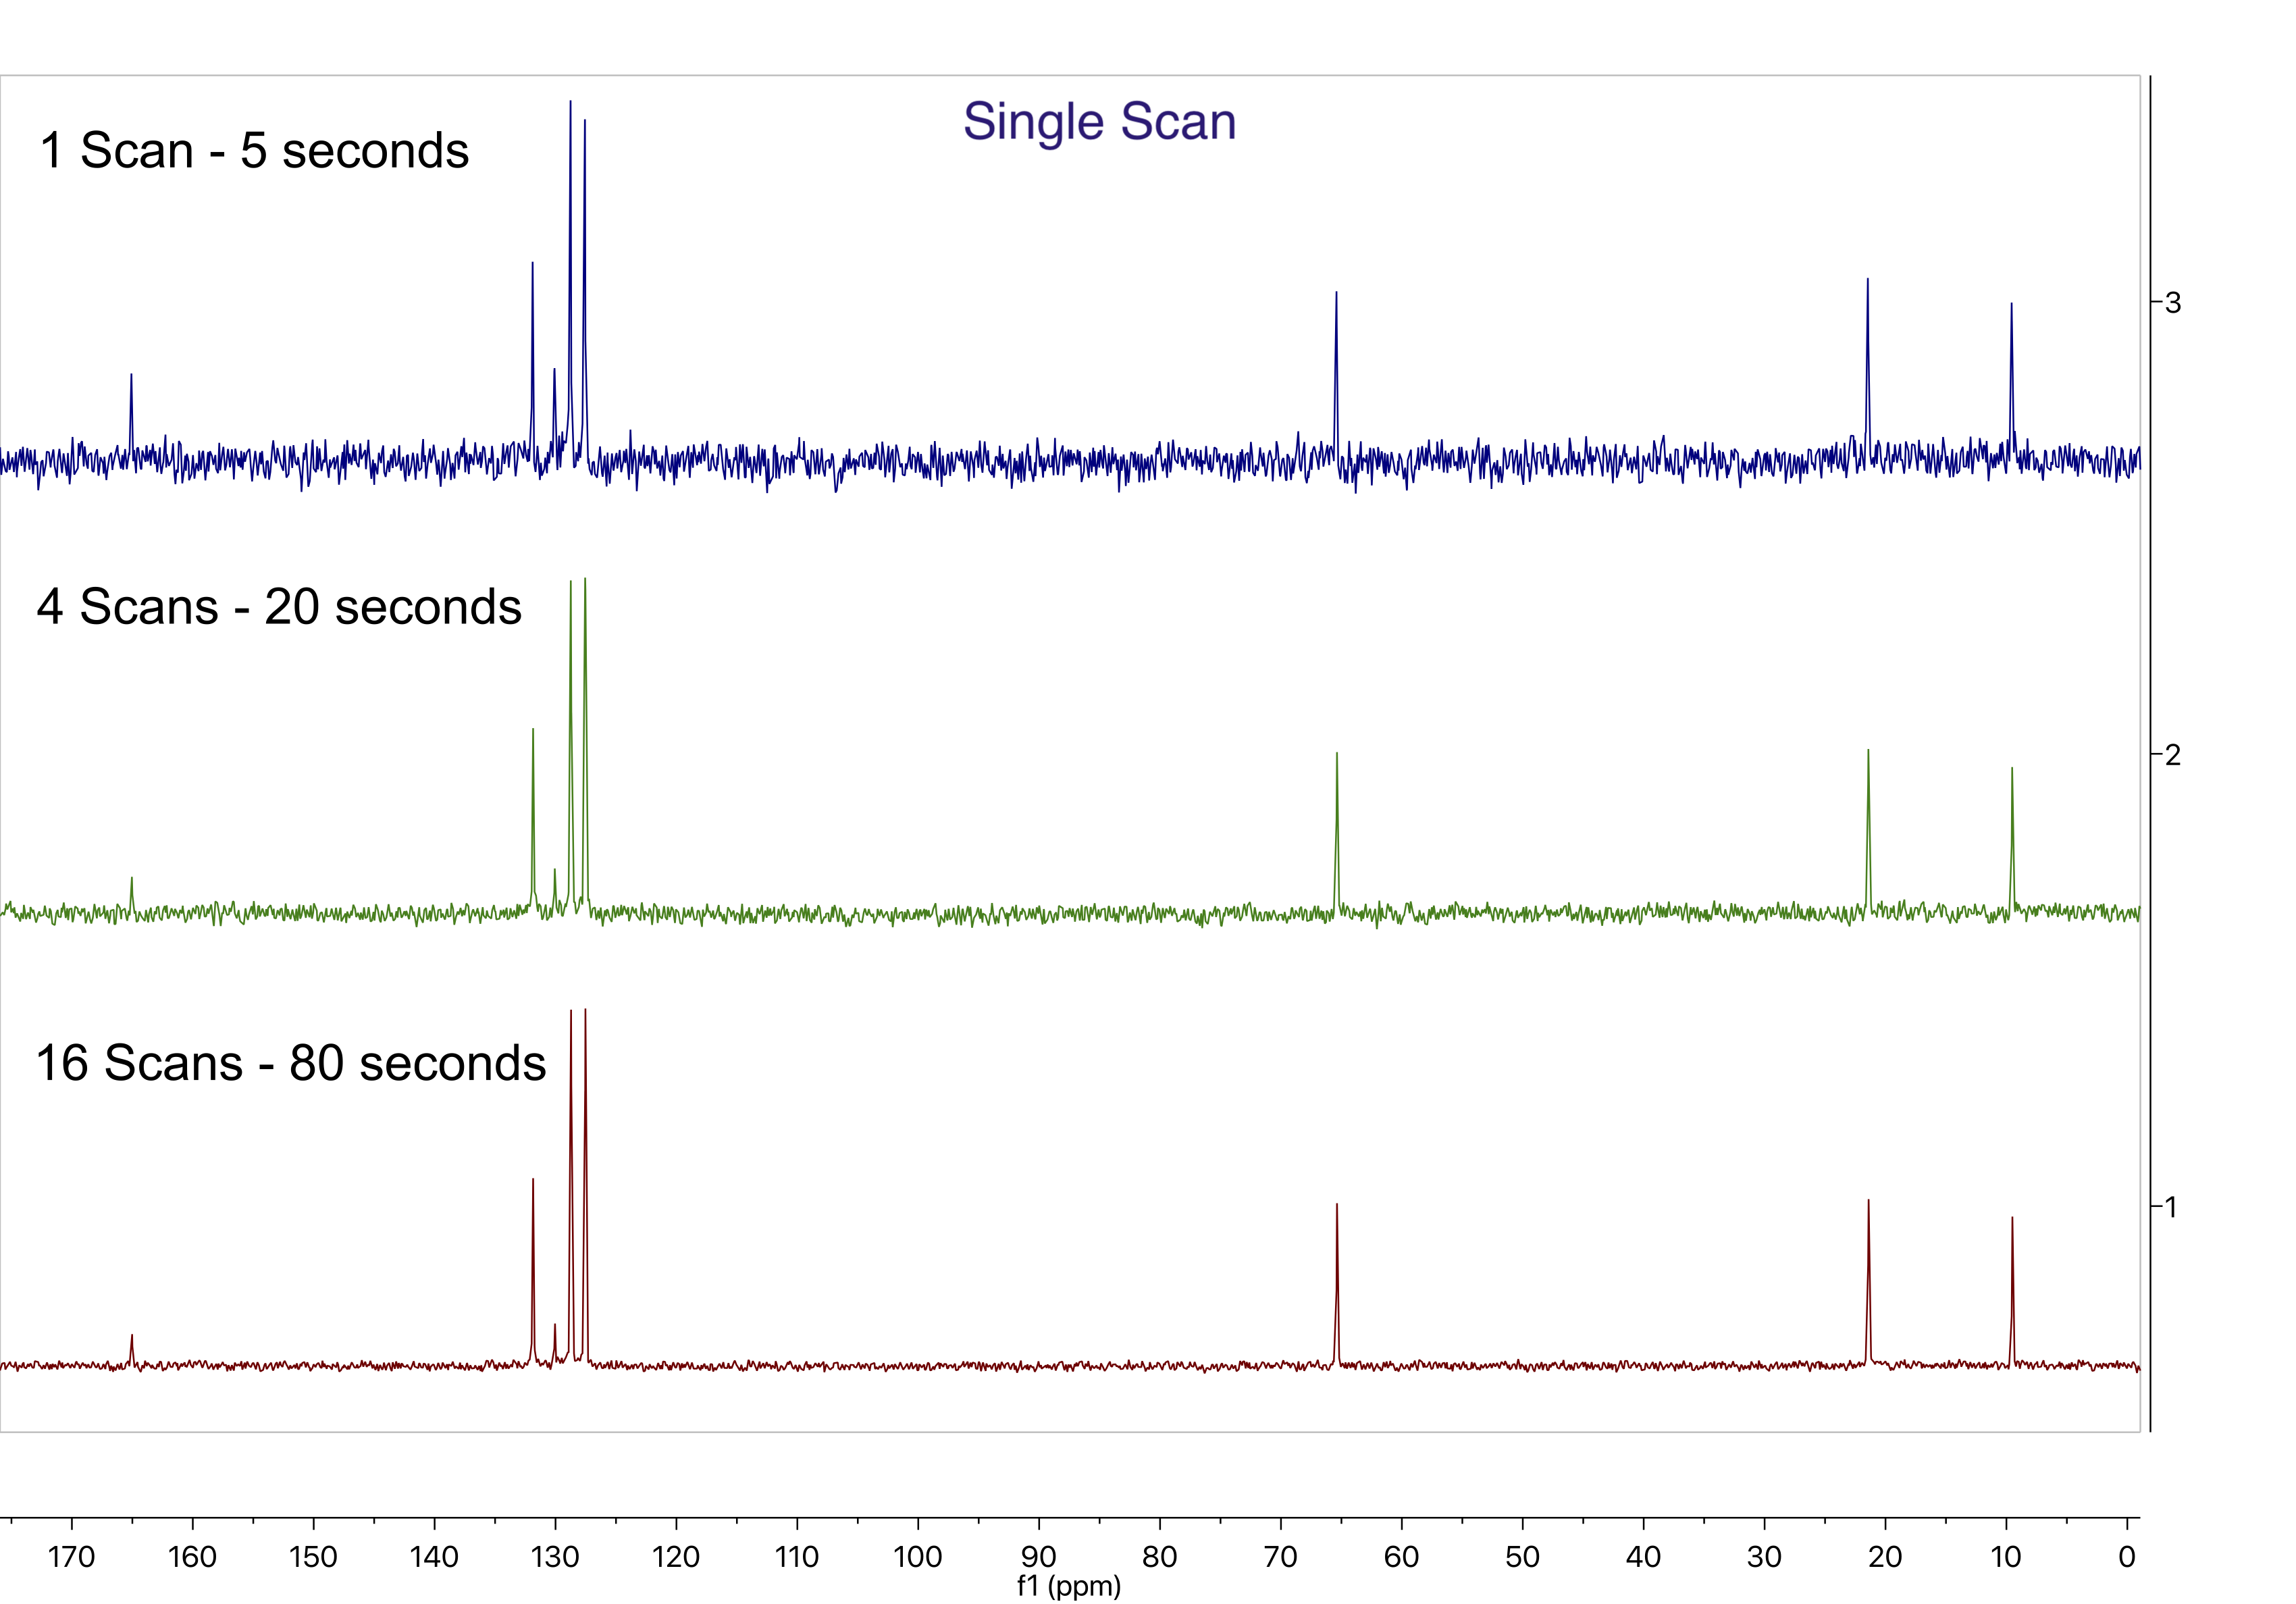
Figure1: 1D 13C NMR spectra of neat Propylbenzoate acquired with a single scan (blue), 4 scans (green) and 16 (red) scans totalling 5, 20 and 80 seconds of acquisition time respectively.
As the concentration of the sample decreases the experiment will take more time depending on the concentration and 13C sensitivity of your instrument. As described in the previous post, the effect of lower sensitivity can cause the experiment time to increase dramatically because of the square root relationship with the number of scans. Because 13C sensitivity is such a critical parameter we want to provide some standards that can be used as reference to understand and evaluate 13C measurements when considering a benchtop NMR instrument.
Let’s start with a typical example. Figure 2 below shows a 13C spectrum collected on a benchtop NMR system with a 1H frequency of 80 MHz, giving a 13C frequency of around 20 MHz. The sample used is a 1 Molar ibuprofen in CDCl3 and the spectrum took 13 minutes to collect using a standard NOE polarisation transfer sequence where proton decoupling is applied during signal acquisition. As you can see from the assignment, all the signals from the different carbon nuclei in ibuprofen can clearly be identified in the spectrum.
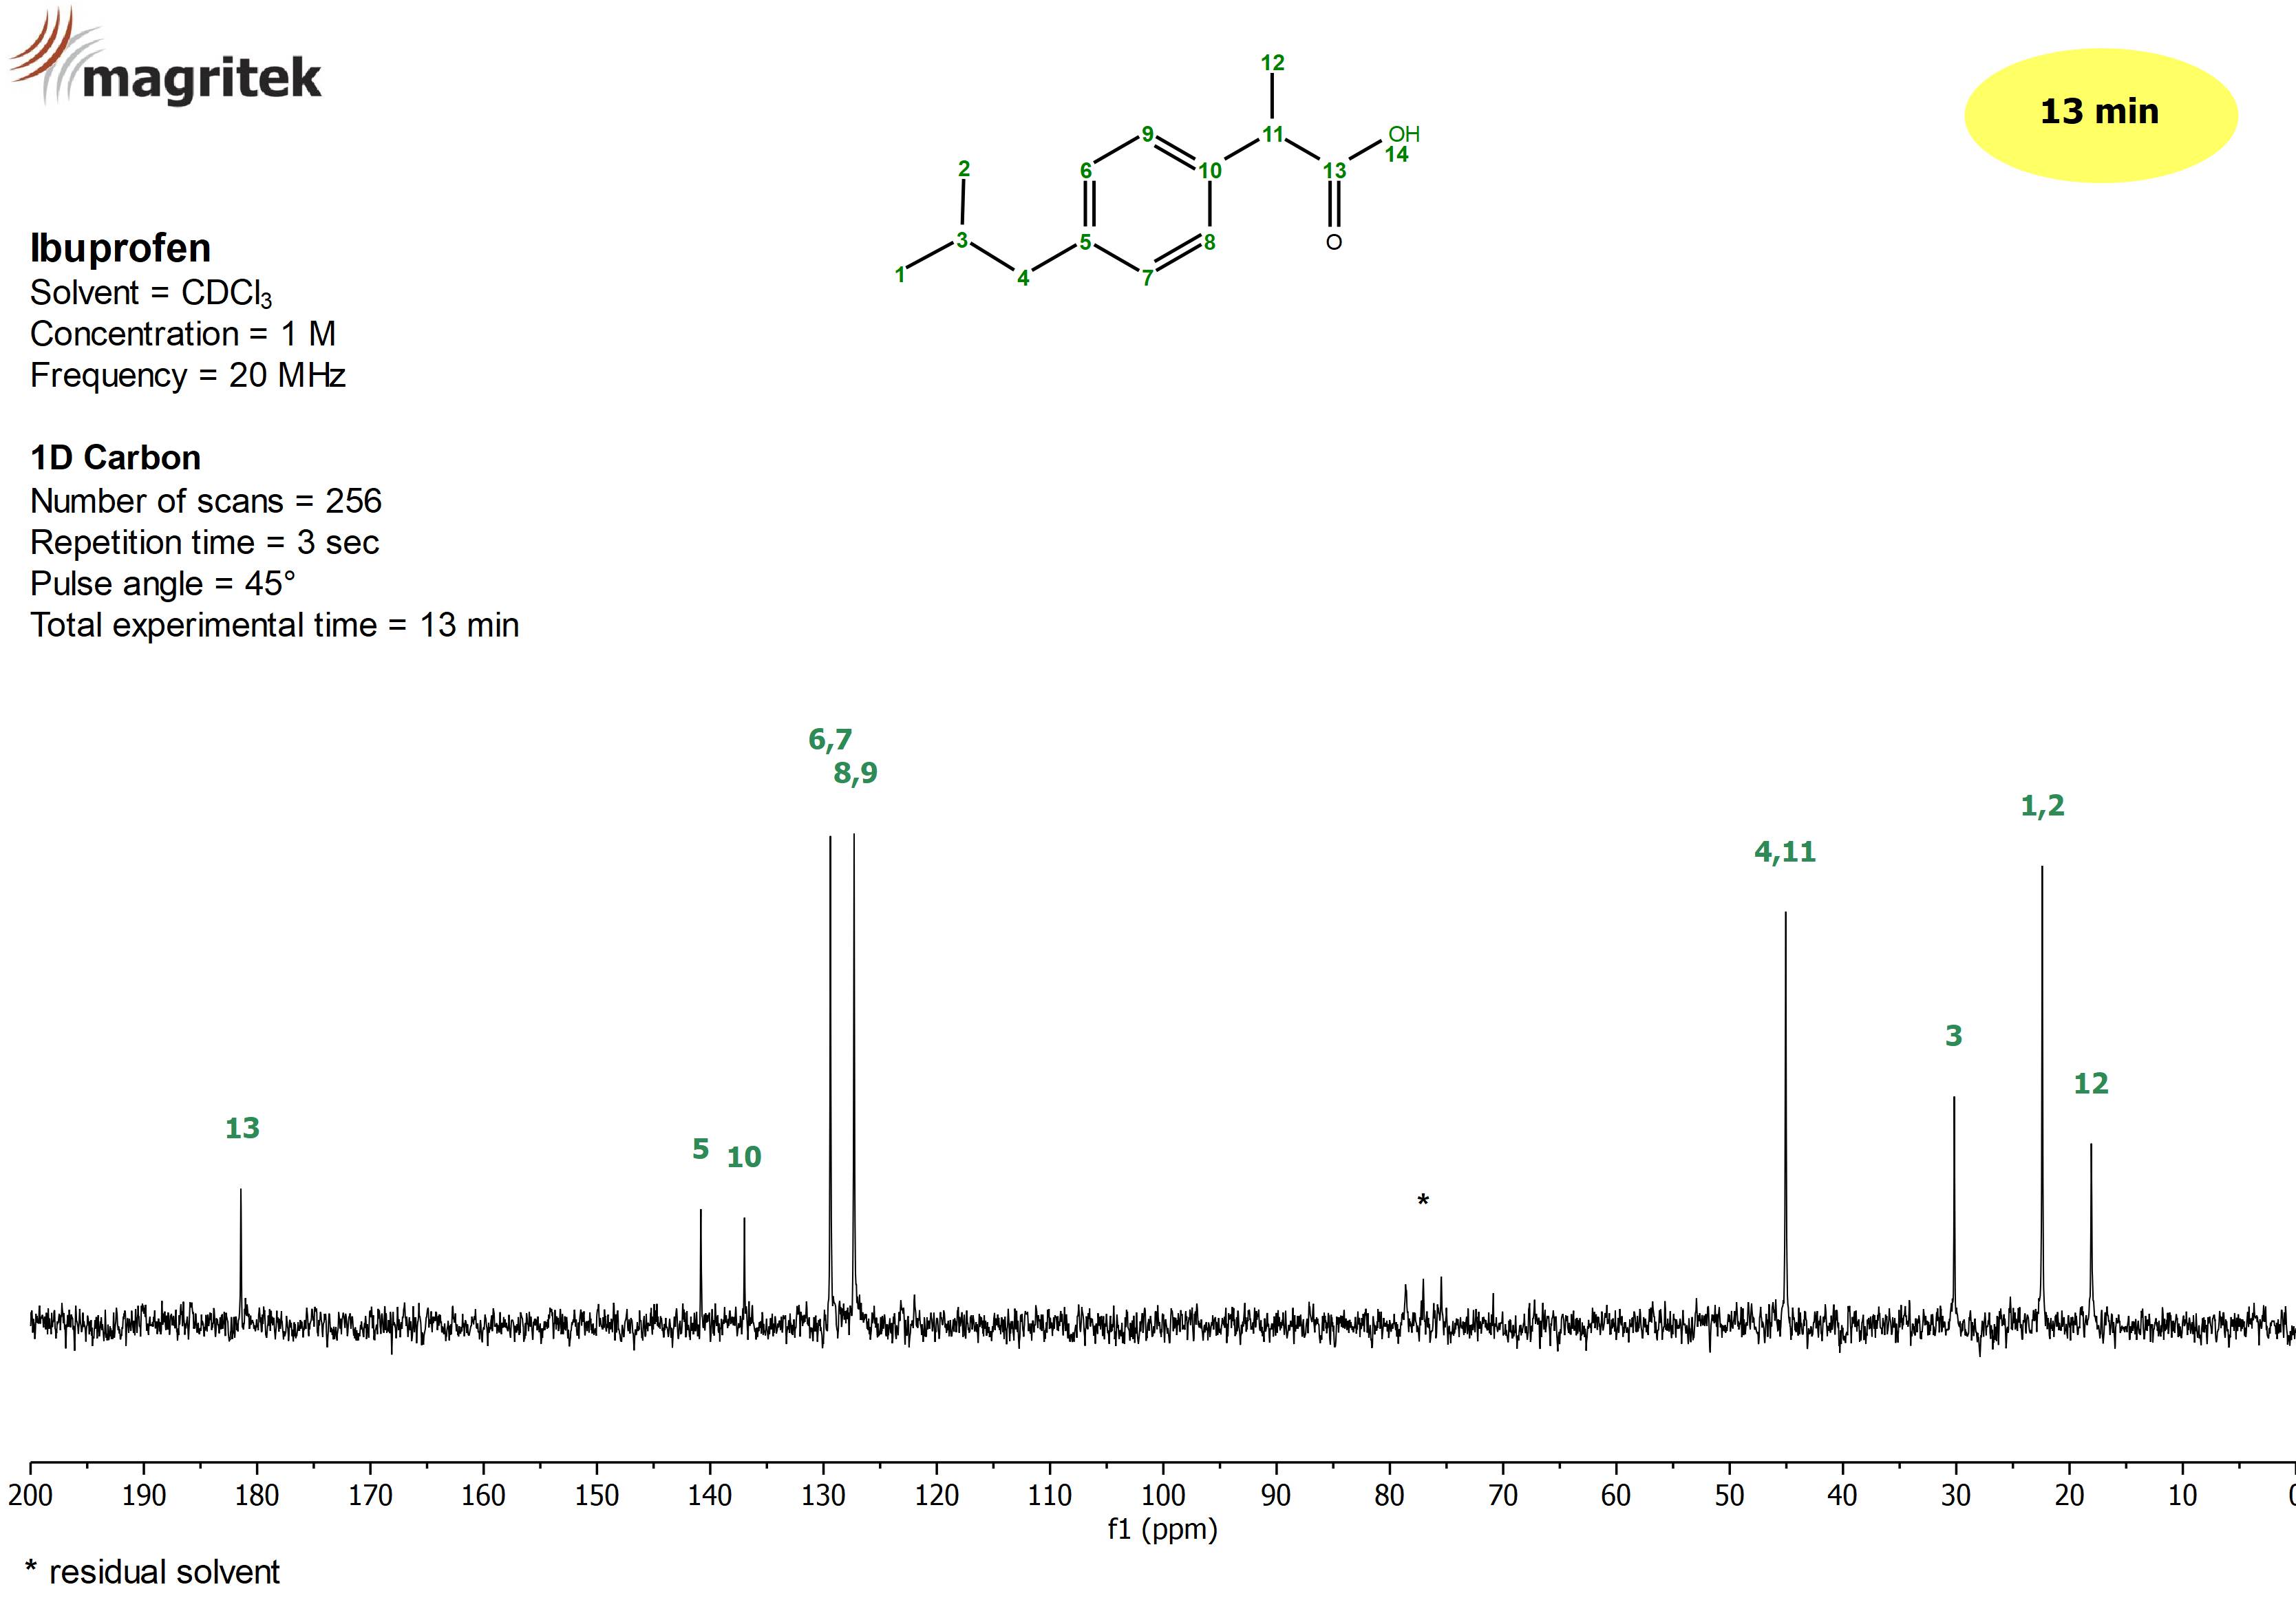
Figure 2: 13C spectrum of a sample of 1 M ibuprofen in CDCl3 collected on an 80 MHz benchtop spectrometer using 256 scans in 13 minutes. The signals from ibuprofen numbered in green, and the solvent peaks are indicated with a *.
Let’s see what happens when an identical measurement is performed on a sample that is one quarter the concentration, 250 mM, equivalent to around 25 mg of ibuprofen in 0.5 ml of solvent. Figure 3 shows the spectrum of this sample.
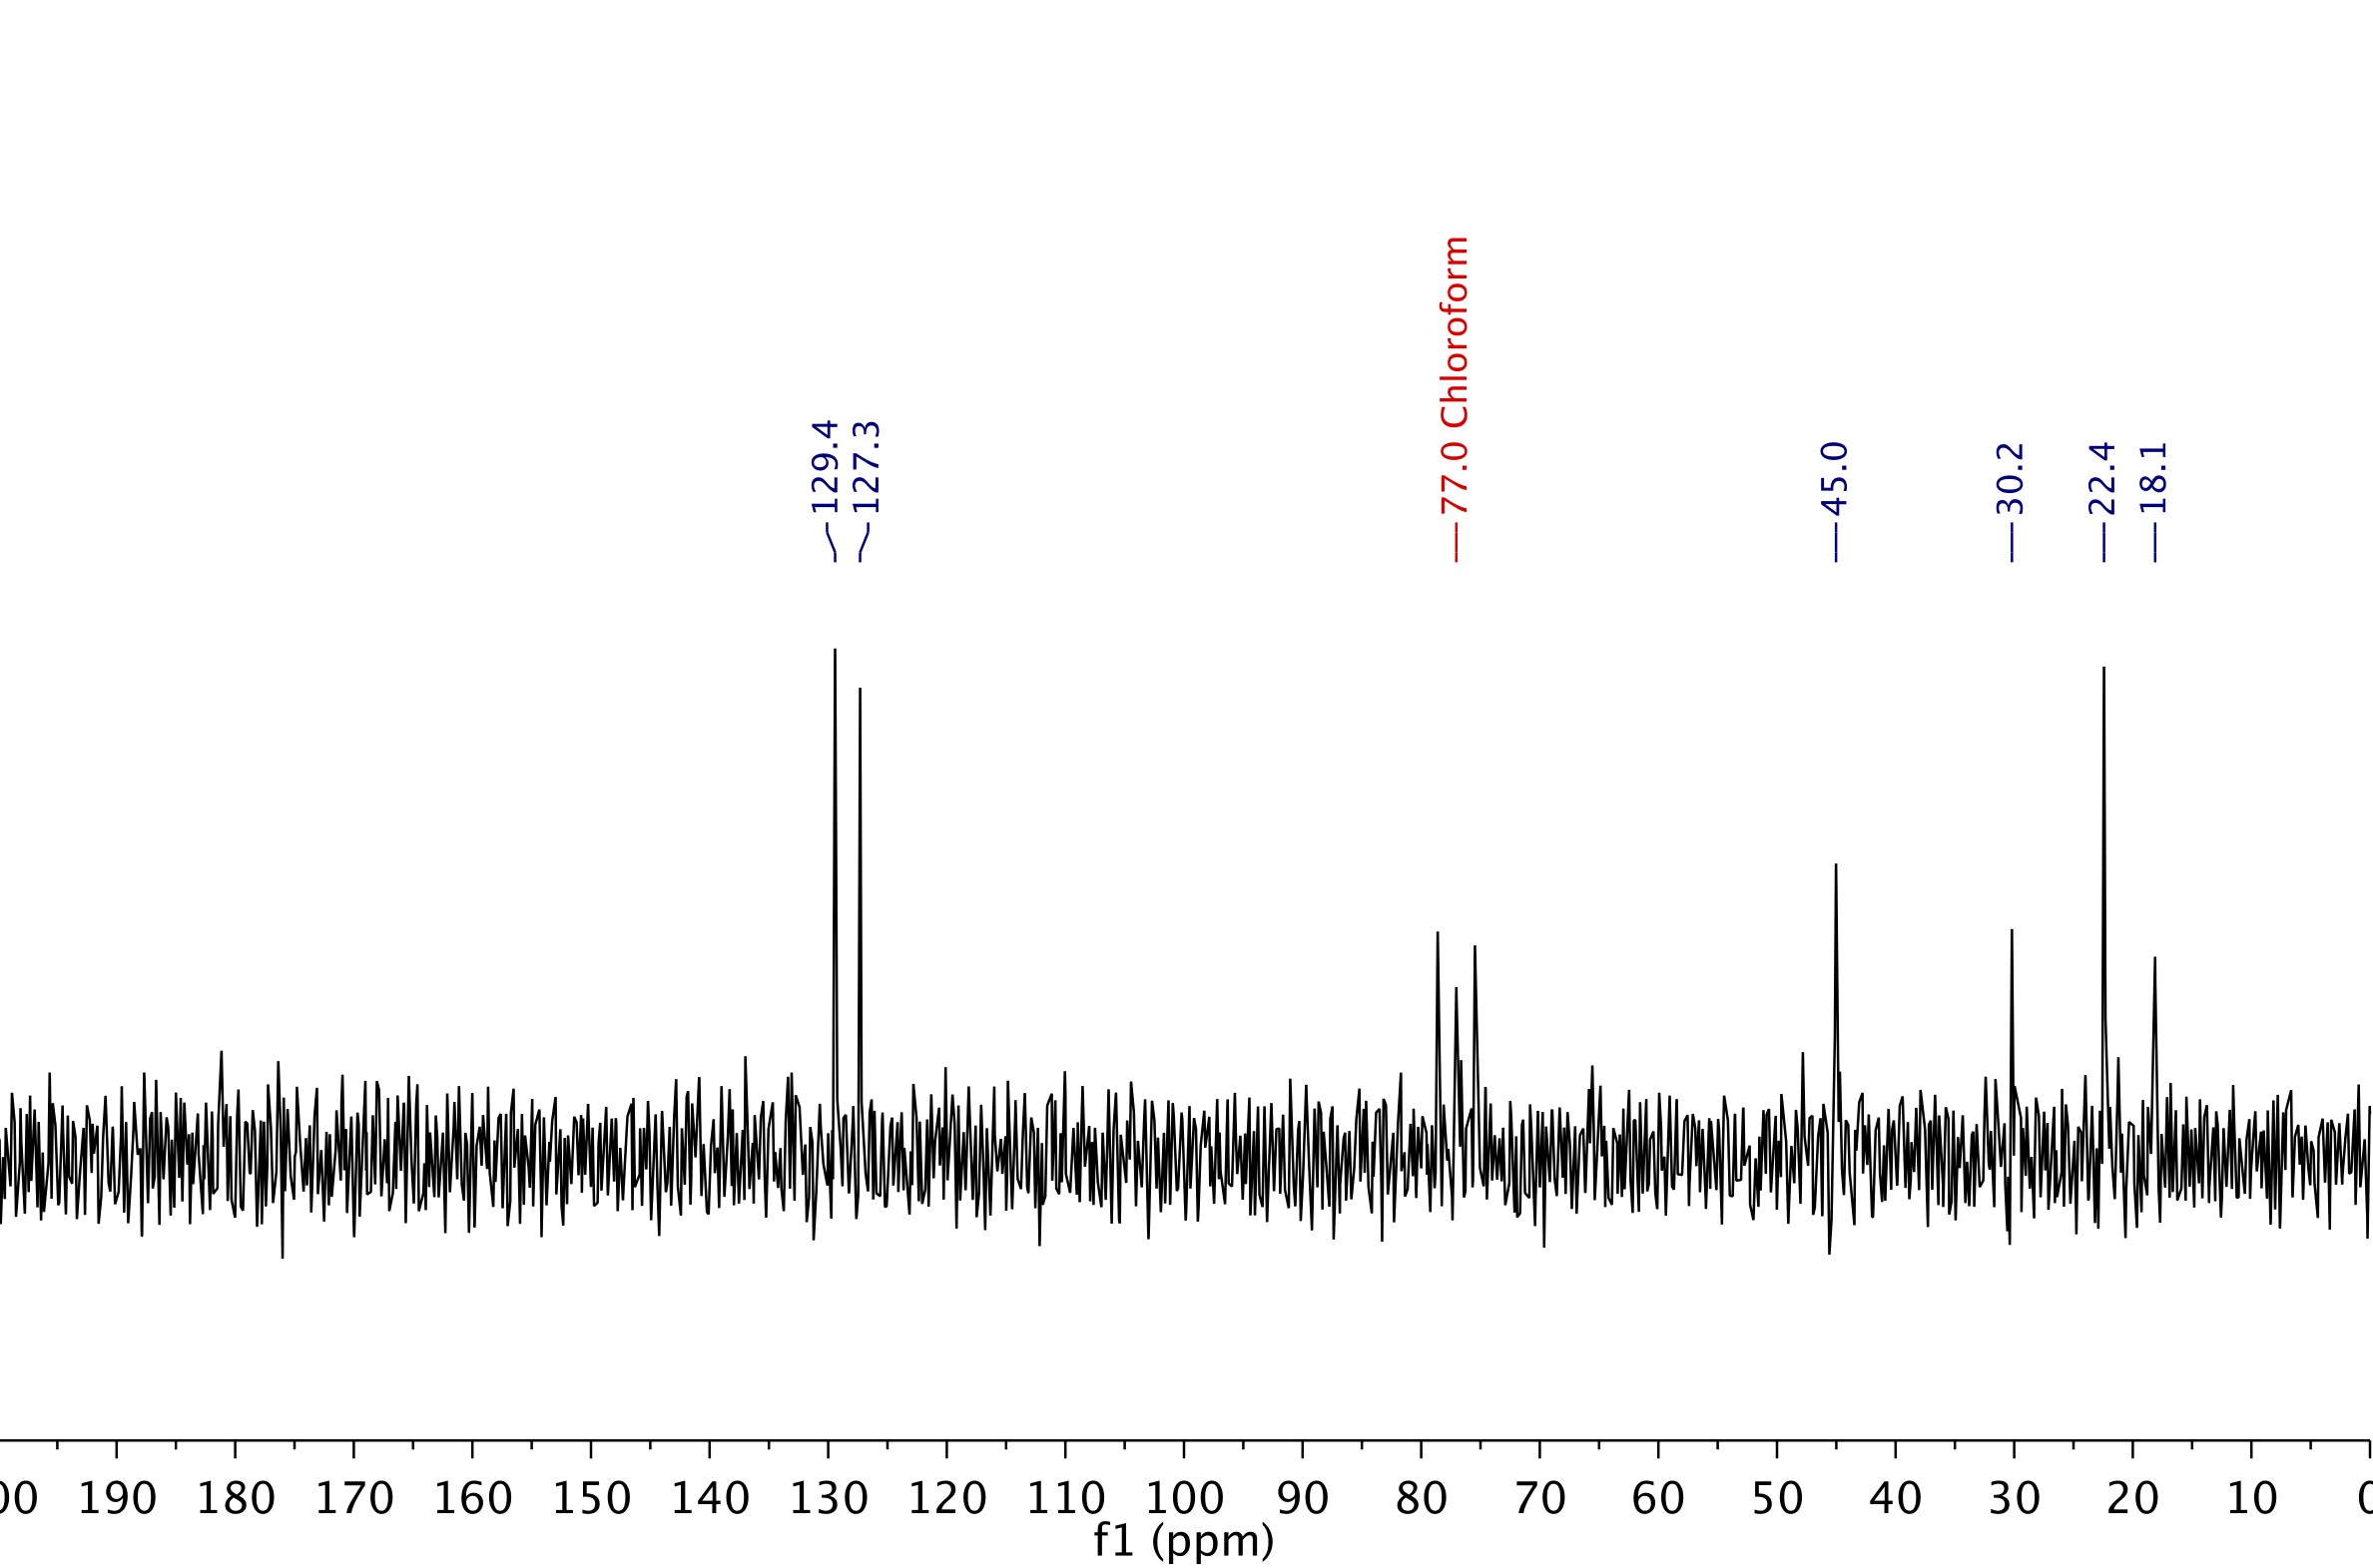
Figure 3. 13C spectrum of a sample of 250 mM ibuprofen in CDCl3 collected on an 80 MHz benchtop spectrometer in 13 minutes with 256 scans. The visible signals from ibuprofen and the solvent are indicated in blue and red respectively.
Right away, we can see that the signal-to-noise ratio (SNR) is significantly lower than in the 1 M spectrum (around a quarter, as expected) and it’s now difficult to distinguish some of the ibuprofen signals from the noise.
As I explained in my last post, we can increase the SNR of the spectrum by signal averaging. According to Eqn. [1] in that post, we’d need to scan for 16 times as long to get the same SNR as for the 1M sample, which would mean accumulating 4,096 scans with a total measurement time of around 3.4 hours. Figure 4 below shows the 13C spectrum collected on the 250 mM sample with 4,096 scans. As you can see, the SNR in the spectrum looks very similar to the spectrum collected on the 1 M sample in 13 minutes. (Note, also, the comparatively much more intense signals from the CDCl3 solvent.)
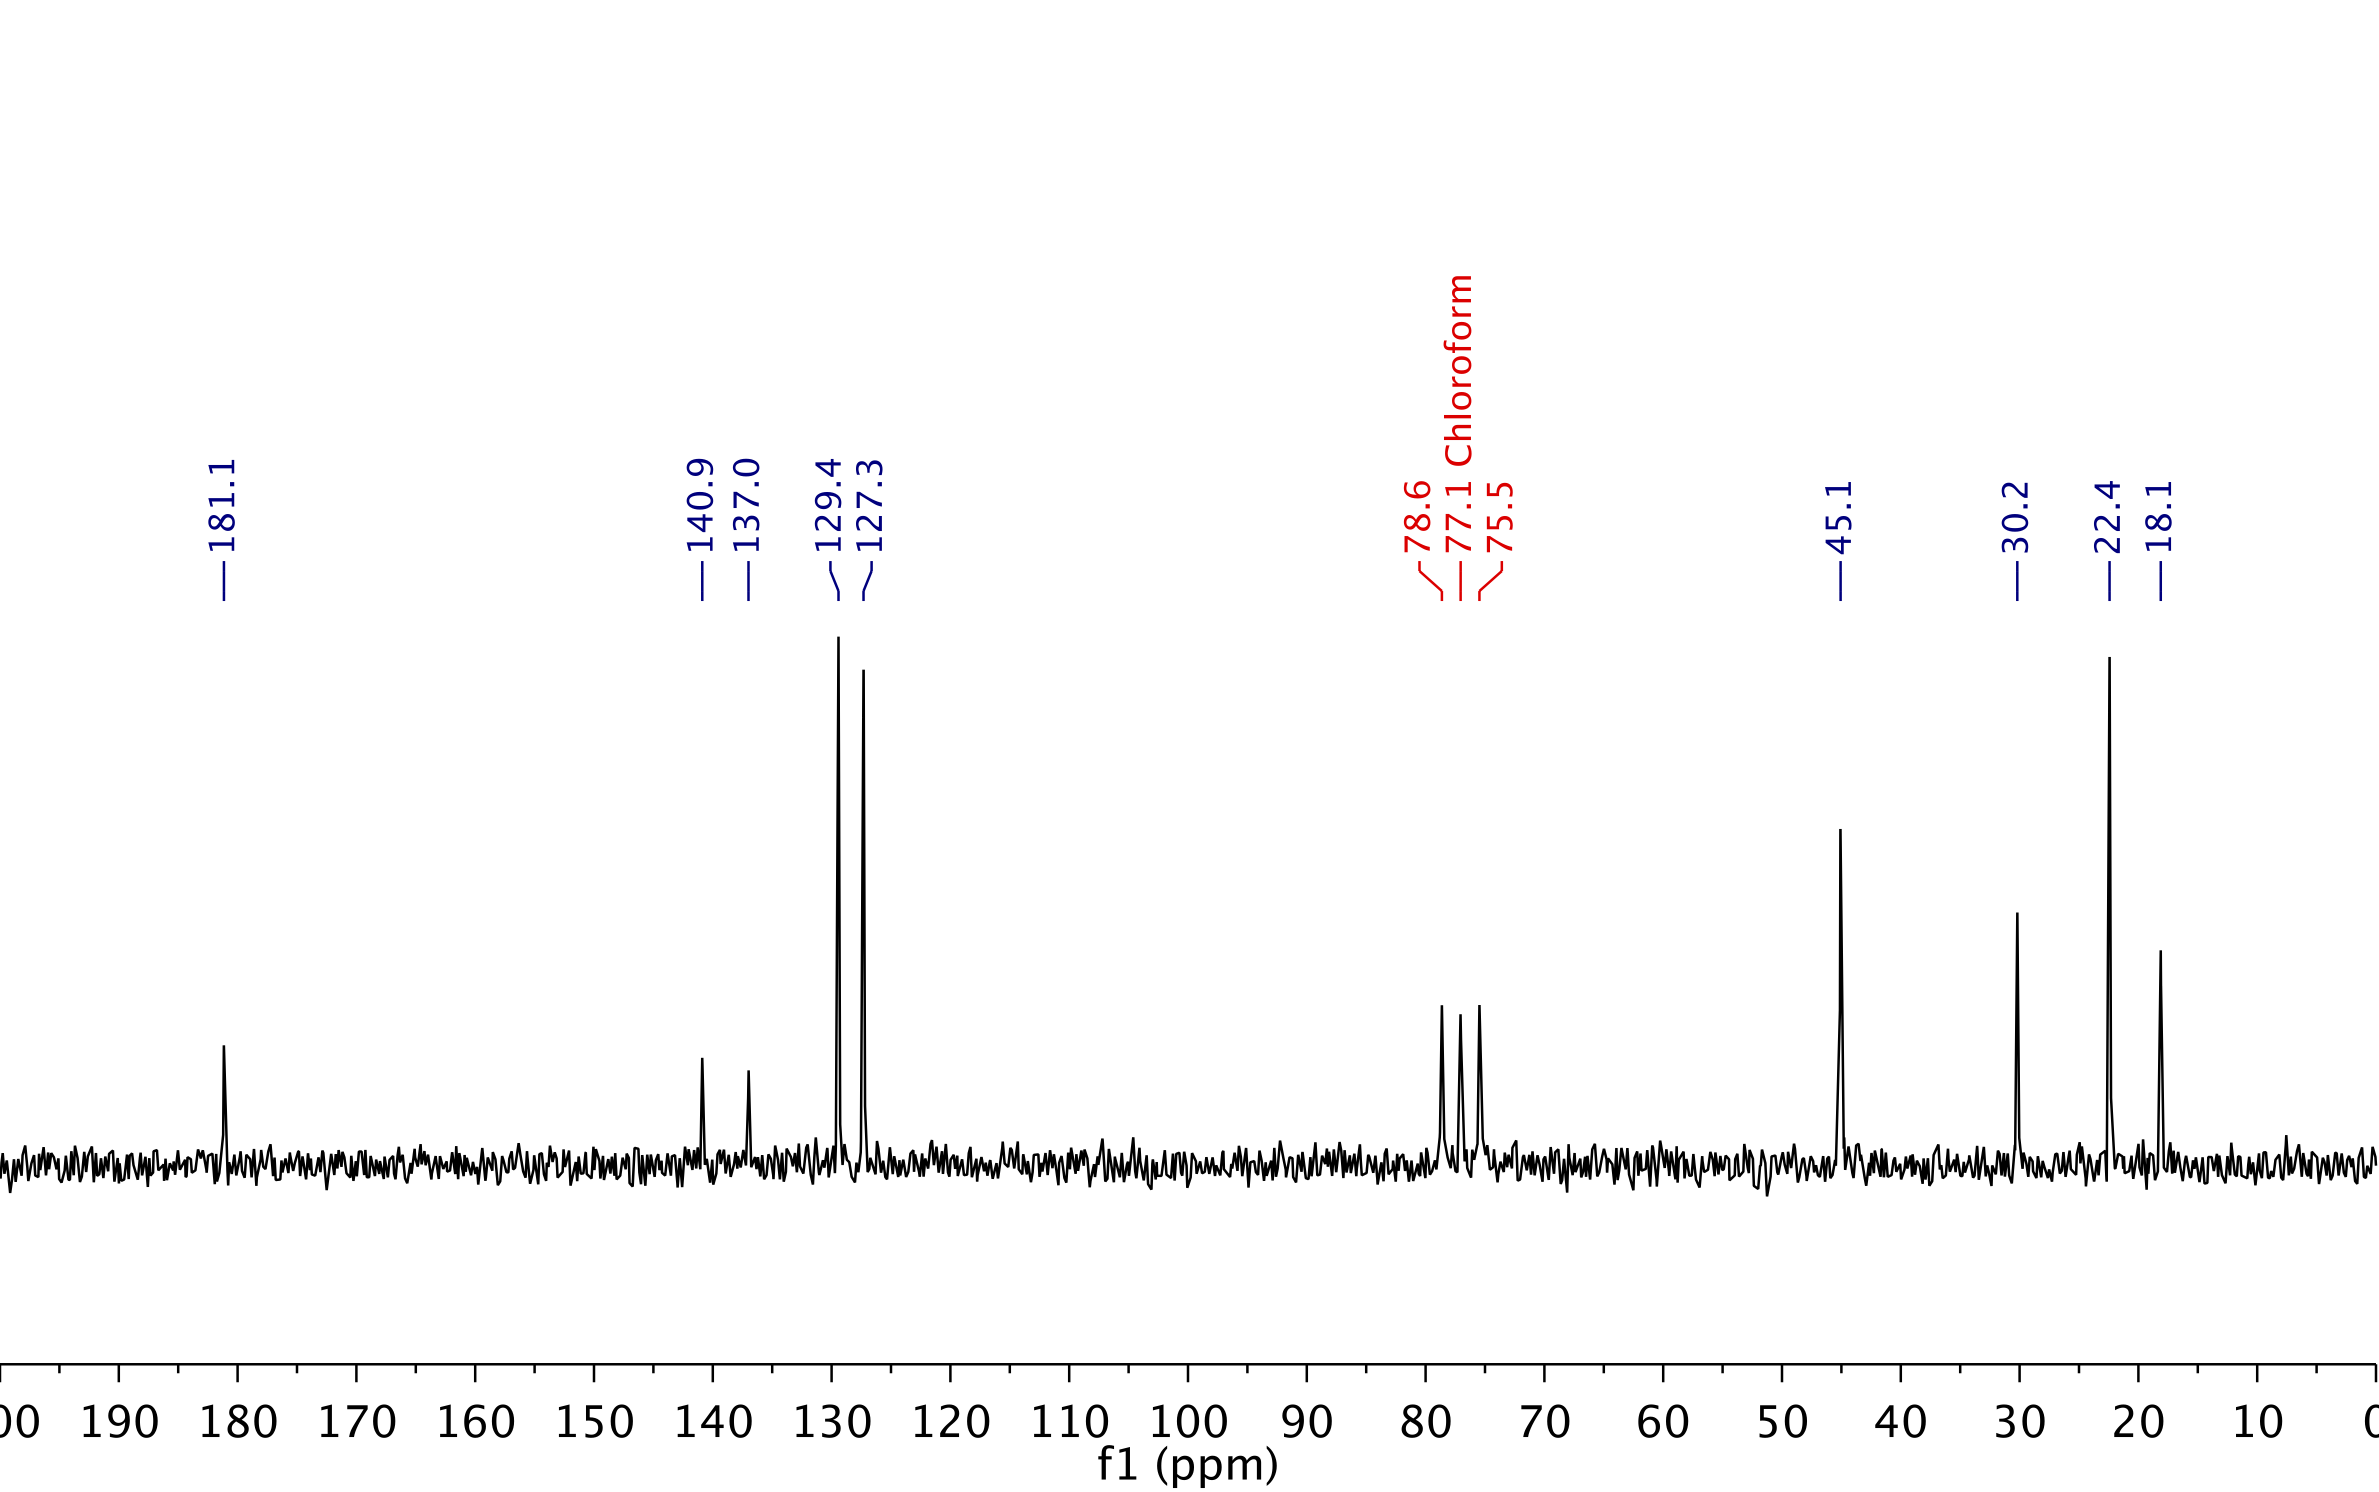
Figure 4. 13C spectrum collected on a 250 mM ibuprofen sample using 4,096 scans in 3.4 hours. The SNR of the spectrum is comparable to the spectrum obtained on the 1 M sample in 13 minutes.
The importance of the instrument’s 13C sensitivity performance starts to become clear. If the 1 M sample had been run on an instrument with one quarter the sensitivity of the 80 MHz instrument used here, it would have taken around 3 1/2 hours to collect a spectrum with the same SNR, the same length of time it took to collect the 250 mM spectrum shown in Figure 4. And collecting a spectrum of the 250 mM sample would require over 2 days to collect, which is impractical for most laboratories and applications.
In my next and final post, I will describe how the 13C sensitivity of a benchtop NMR system can be evaluated.