In a previous post we demonstrated the use of multiple peak solvent suppression on the Spinsolve ULTRA benchtop NMR spectrometer. While the sequence effectively suppressed 3 NMR solvent peaks, it did not reduce the carbon satellites of the solvent which are at a different frequency, and had a similar intensity to our compound of interest and therefore might interfere with our measurements. Fortunately on a Spinsolve ULTRA Carbon spectrometer we can use the carbon channel to do 13C decoupling at the same time as suppressing the solvent peaks. An example of multiple peak solvent suppression with carbon decoupling is shown below in Figure 1. Notice how the peak labelled with the purple dot is revealed once the carbon satellites are suppressed.
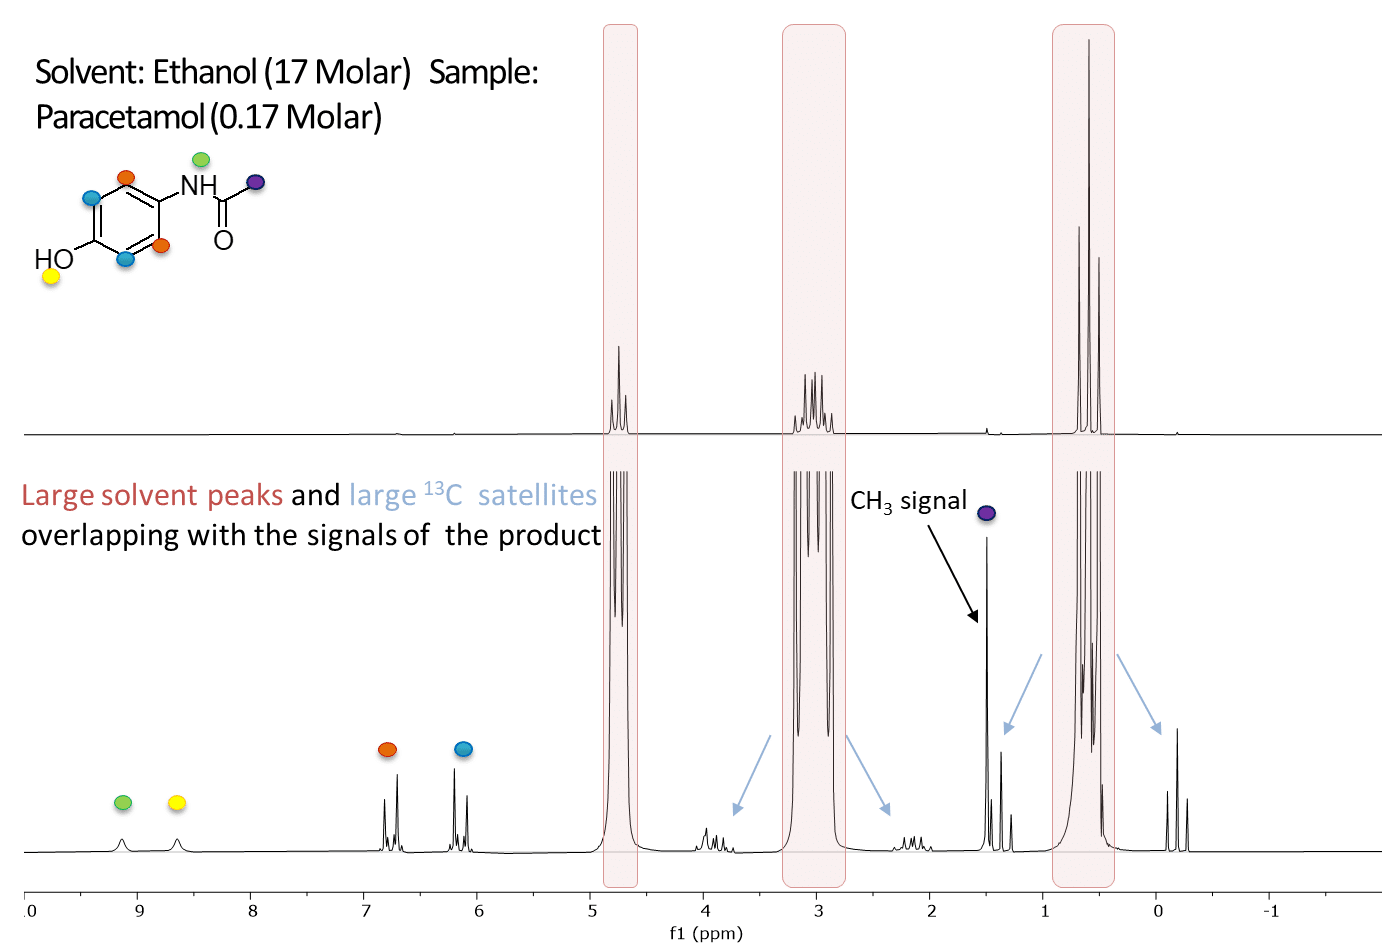
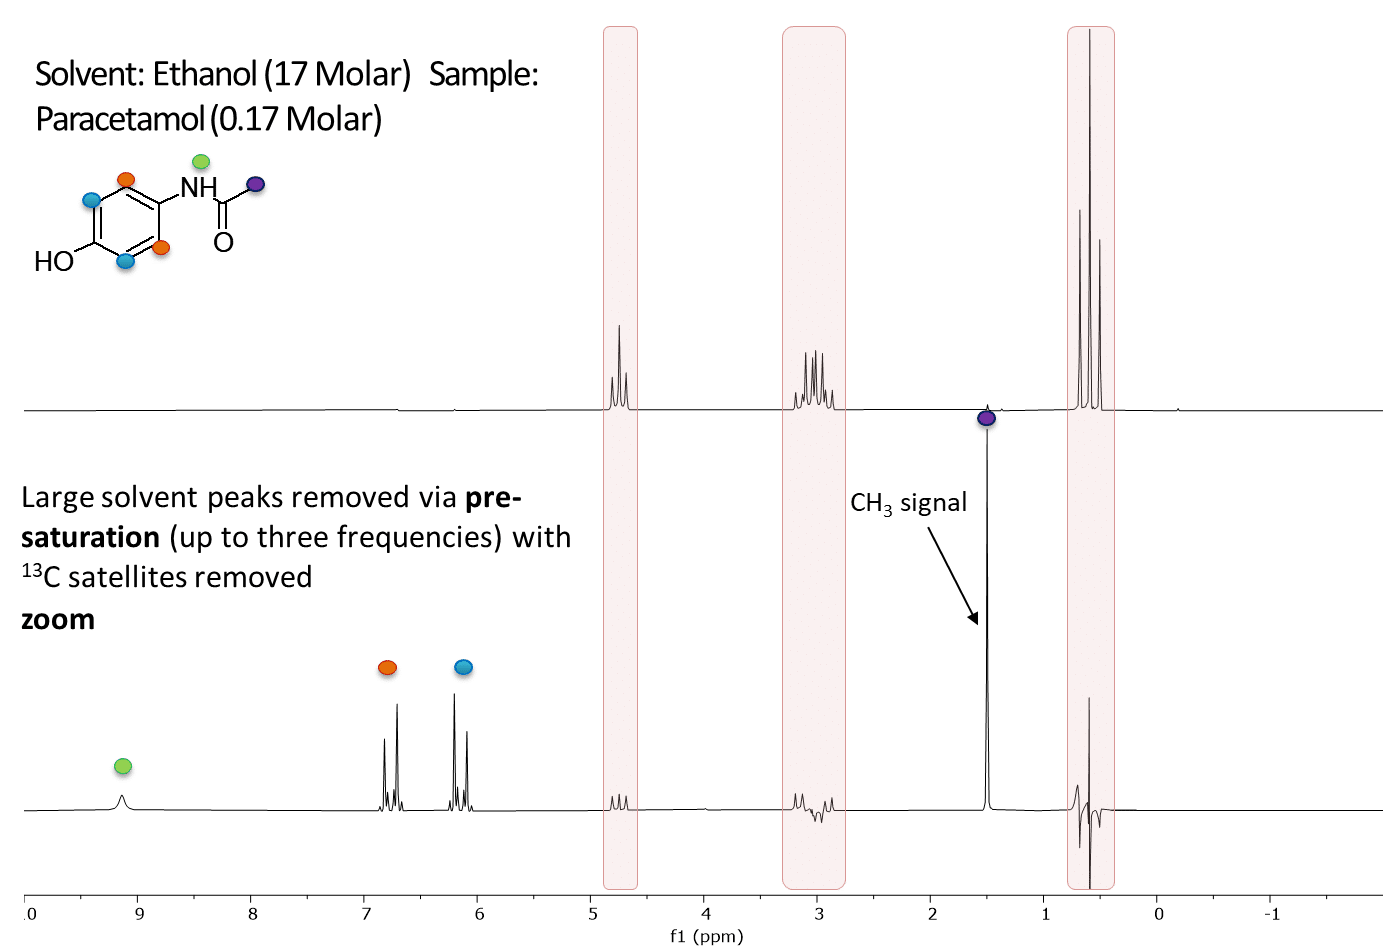
Figure 1: The image above shows a 1D proton spectrum of 170 mM Paracetamol dissolved in normal protonated Ethanol acquired with multiple peak solvent suppression at the frequencies indicated by the 3 red arrows on a Spinsolve 60 ULTRA Carbon (top, red). The green dots identify the carbon satellites of the solvent peaks in the spectrum. The second spectrum (bottom, blue) shows the same sample acquired with multiple peak solvent suppression but now with carbon decoupling. This causes the carbon satellites of all peaks to be removed, including those from the solvent. The peaks which remain belong to the paracetamol and are identified with the the blue, orange, purple and yellow dots.
Combining solvent suppression and 13C decoupling is very useful for any sample dissolved in a protonated organic solvent. Applications include reaction monitoring, or as shown in Figure 2 below, measuring a sample of Malbec wine revealing the components dissolved in the water/ethanol solvent.
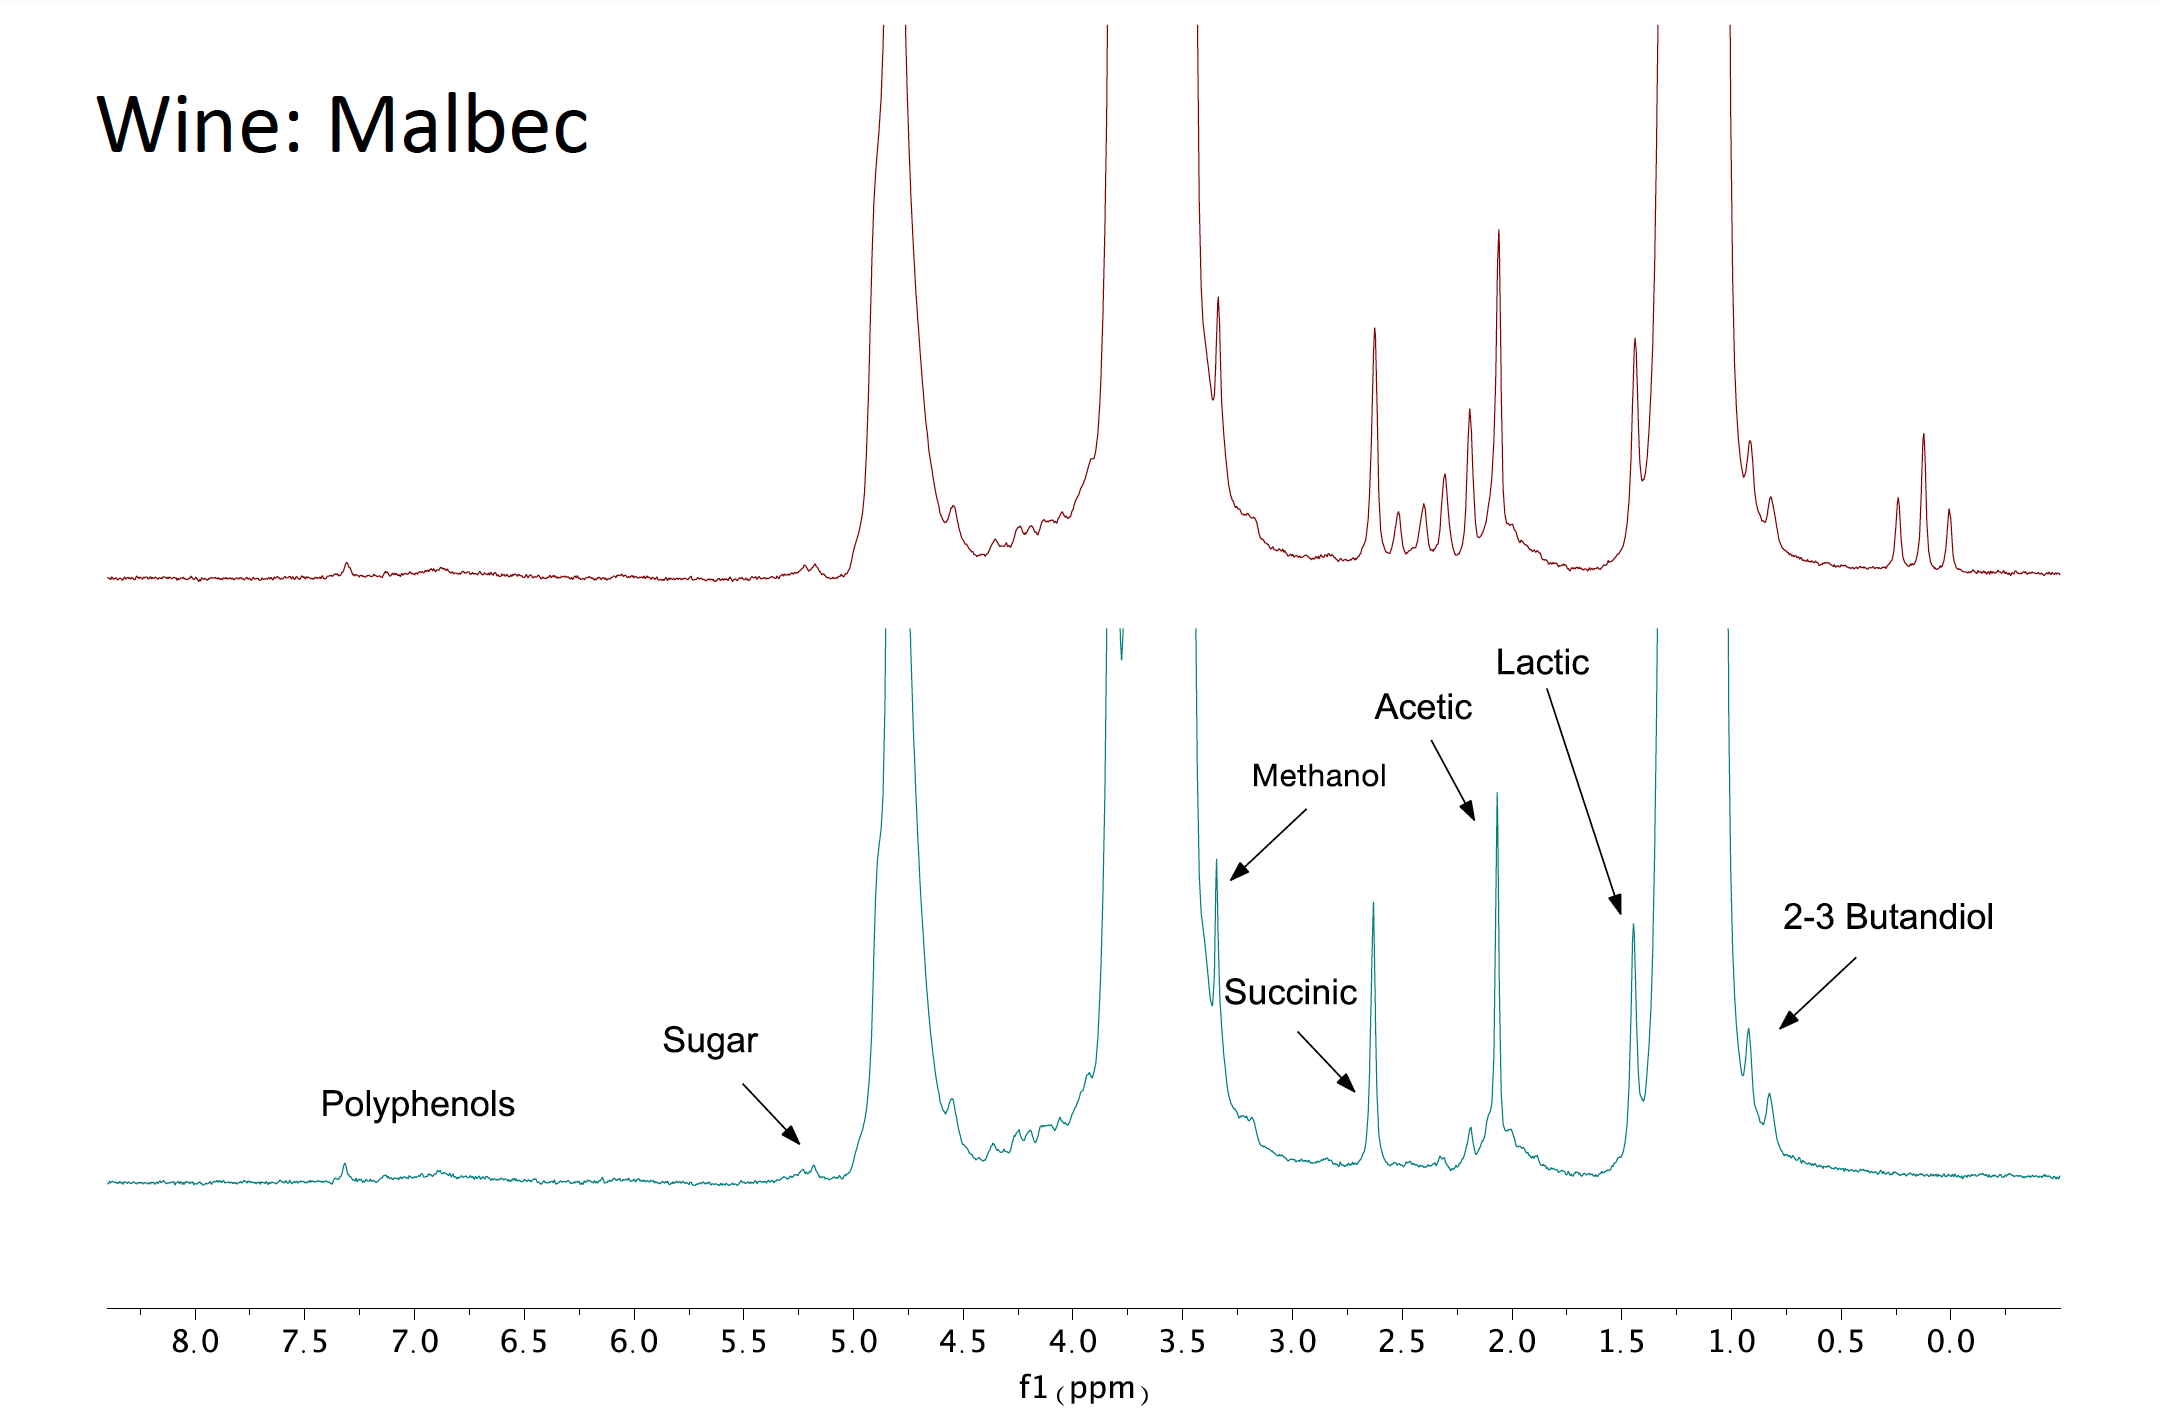
Figure 2: A 1D proton NMR of Malbec wine acquired on a Spinsolve 60 ULTRA Carbon spectrometer. The top (red) spectrum is acquired without carbon decoupling while the bottom (blue) spectrum is acquired with carbon decoupling. Removing the carbon satellites of the ethanol immediately shows the NMR peaks corresponding to dissolved compounds which are then labelled in the figure.
It is worth noting that both solvent suppression and carbon decoupling sequences require exceptional stability and performance from your spectrometer to give useful data, in particular the lineshape and resolution of the Spectrometer must be very good for the sequence to work. To learn more about how to measure lineshape and resolution please read our earlier post on this topic.