Assigning peaks in the NMR spectrum is a fundamental part of structure verification. Depending on a variety of factors including the size and complexity of the molecule, and the field strength the NMR data are collected at, this can be a straightforward exercise or an extremely challenging one! For example, in the case of a fairly simple compound like lidocaine, it is relatively easy to assign all of the peaks directly in the 1H spectrum using a 43 MHz benchtop NMR spectrometer. However, as a compound’s molecular weight increases so the spectra tend to become more complex, with more resonances and, inevitably, more signal overlap. Assigning the peaks thus becomes significantly more challenging, which is where collecting 2D NMR spectra can help with completing the assignments.
Quinine (C20H24N2O2, MW 324.42, Figure 1) provides an excellent example for learning how to apply 2D NMR methods to the problem of peak assignments on more complex molecules using a Spinsolve 80 Carbon benchtop NMR spectrometer. Even at higher field strengths (e.g. 300 and 400 MHz), assigning the 1H and 13C peaks is by no means trivial.1
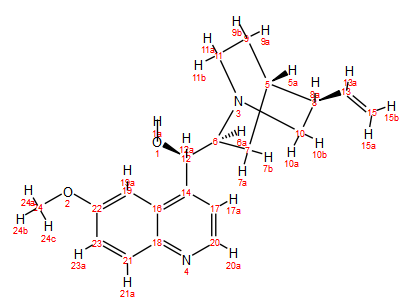
Figure 1. Structure of quinine
Over the course of my next few posts, I’m going to show how the different structural and spectroscopic information provided by a variety of 1D and 2D NMR spectra collected at 80 MHz can be used to assign the 1H and 13C peaks of quinine.
The sample used in this study comprised 130 mg quinine dissolved in 1 mL DMSO-d6, giving a quinine concentration of 400 mM. In fact, this concentration is much higher than was needed to collect most of the 2D spectra but was high enough to allow some of the less sensitive experiments to be run in a relatively short time.
1H NMR Spectrum
As with most organic molecule peak assignment problems, the first step is to collect a 1H 1D spectrum. Figure 2 shows the 1H spectrum of the quinine sample, collected using 8 scans in just over one minute.

Figure 2. 80 MHz 1H NMR spectrum of quinine
Several resonances in the 1H spectrum can be positively or tentatively assigned based on their chemical shifts, J-splitting patterns and coupling constants, and integrals. The large methoxy singlet is clearly H24abc without scalar coupling due to the oxygen. If we fix this peak integral to 3, due to the 3 protons, we note the total integrals of all proton peaks comes to a bit over 24. We are expecting 24 protons so there may be some impurities or residual solvent protons present, too.
The two clearly separated aromatic doublets at 8.33 ppm and 7.59 ppm can only be H20 and H21, with H20 more downfield due to the adjacent Nitrogen. The proton at H23 is a doublet of doublets due to H19 and in the region of 7.03 ppm but overlapping with two other protons in that region. We suspect H15 is at 4.6 ppm due to its chemical shift but assign this only tentatively for now.
| Atom | 1H (ppm) | Peak Splitting Pattern |
J (Hz) |
| 24 | 3.55 | — | — |
| 20 | 8.33 | d | 4.5 |
| 21 | 7.59 | d | 9.1 |
| 23 | 7.03 | dd | 9.1, 2.7 |
| 15 (tent.) | 4.6 | m | — |
Table 1. Preliminary 1H peak assignments obtained from the 1H 1D spectrum
As anticipated, however, there is quite a lot of overlap in the spectrum, particularly in the aliphatic region, and most of the other resonances cannot yet be assigned.
In my next post, we will look at the 13C NMR spectrum of quinine before moving on to look at 2D methods.
You can click here to download the Quinine Case Study